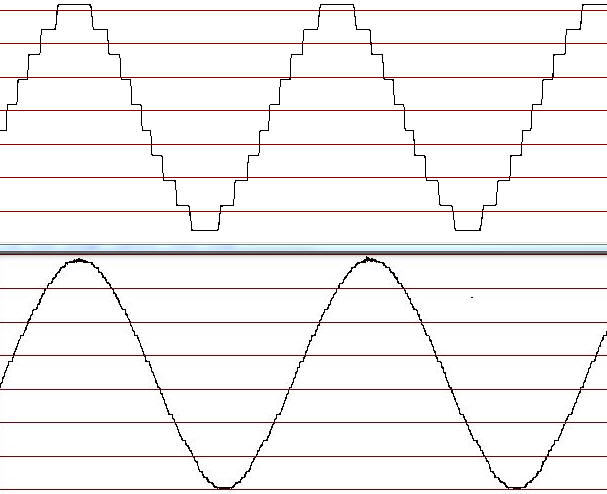

The PicAXE analog-to-digital converter appears to have precision well beyond the minimum necessary to achieve a monotonic response; the steps look fairly precise in amplitude. So it seemed possible to add some sort of analog dithering to the voltage to be measured to get an average value between the steps. My first try appears to work quite well! I decided to shoot for two bits of improvement (from 10 to12 bits "or so"). The first experimental results are shown below. A very low frequency generator is heavily divided down and biased to average Vcc/2 (about 2.5 volts) such that the PicAXE would be measuring tiny voltages near the center of the range to make the steps visible. Amaseis is used to record the PicAXE's measured values. The first plot below clearly shows the steps due to the limited 10 bit resolution. Note the uniform step size. The second plot (adjusted to have the same gain) shows the technique's improvement rather clearly. The design is simple; a 3.3k resistor is inserted in series with the 08M2 PicAXE's voltage input (pin 3 or C.4) and 10 megohm resistors are connected from pins 5 and 6 (C.1 and C.2) to pin 3. Making pins 5 and 6 cycle through high, low, and floating causes the input voltage at the PicAXE to vary up and down by about 1 bit's worth. In the experiment there are five states with both pins pulling up, only one pin pulling up, both pins floating and one then two pulling down. Five loops sum the voltage 10 times each then add the results for a total of 50 measurements. (I chose 50 measurements or a total as high as 51150 but that makes the gain lower than the top plot that displays 16 bits, or 65,534 max, hence the gain adjustment I mentioned above.)
Note: the 3.3k input resistor should be driven by a low impedance source, typically the output of an op-amp. In the test below the two, 200 ohms are sufficiently low.

This experiment is now using a very slow 2 mHz sine wave so that Amaseis can make good resolution plots. A much faster setup could measure each of the five voltages only once instead of 10 times.

When the input signal moves away from Vcc/2 the dithering signals become unbalanced since the voltage across the resistors will not be symmetrical when switching between Vcc and ground. It turns out it works fairly well, anyway. Below is the less-pretty sine wave when the DC input voltage is lowered from 2.5 volts (Vcc/2) to 1.25 volts. The plot to the right is with the voltage dropped to 0.25 volts so the dithering is basically in only one direction. In both cases I dropped the voltage simply by dropping the 5VDC at the top of the 200 ohm resistor divider (different power supply).


They're not as smooth but it's still far better than nothing and in many applications this slight degradation isn't a problem. For example, my "water hammer seismometer" is centered at Vcc/2 and the smoother curve lets me zoom in to see the tiniest wiggles from distant quakes. If a quake or other disturbance drives the signal a volt away from center the loss of some of the smoothing is insignificant because the large signal would look smooth with only 10 bits. And the smoothing is still pretty good at the extremes.
Here's the program that makes the smoothed curves above and at the bottom (in comment form) is the program that shows the A/D's limited resolution (first plot at the top of this page).
'Program uses analog dithering for better resolution. 10 values are summed in
each of 5 dither states.
'For a total of 50 values. The sum of the 5 sums is the output.
'10 megohm resistors connect from C.1 and C.2 to C.4 and the analog signal
connects through a 3.3k
'resistor to C.4. Changing the outputs of C.1 and C.2 can thus move the input
voltage up or down
'a slight amount, about one bit's worth.
'Simple program to show the
10 bit resolution:
'main:
'setfreq m8
'senddata:
'for b0 = 1 to 64 ; the sum of 64 10-bit readings fits into a 16 bit word
variable
'readadc10 C.4,w1
'w2=w2+w1
'next b0
'sertxd(#w2,13,10)
'w2 = 0
'pause 130
'goto senddata